I have a new Mac Studio, and when I run heavy workloads on it I notice it getting hot and the fans spinning up. I wanted to know where that heat was actually coming from — the CPU, the GPU, or both — and how hot things really get over time. Activity Monitor doesn’t tell you any of that.
So I vibe coded a temperature logger.
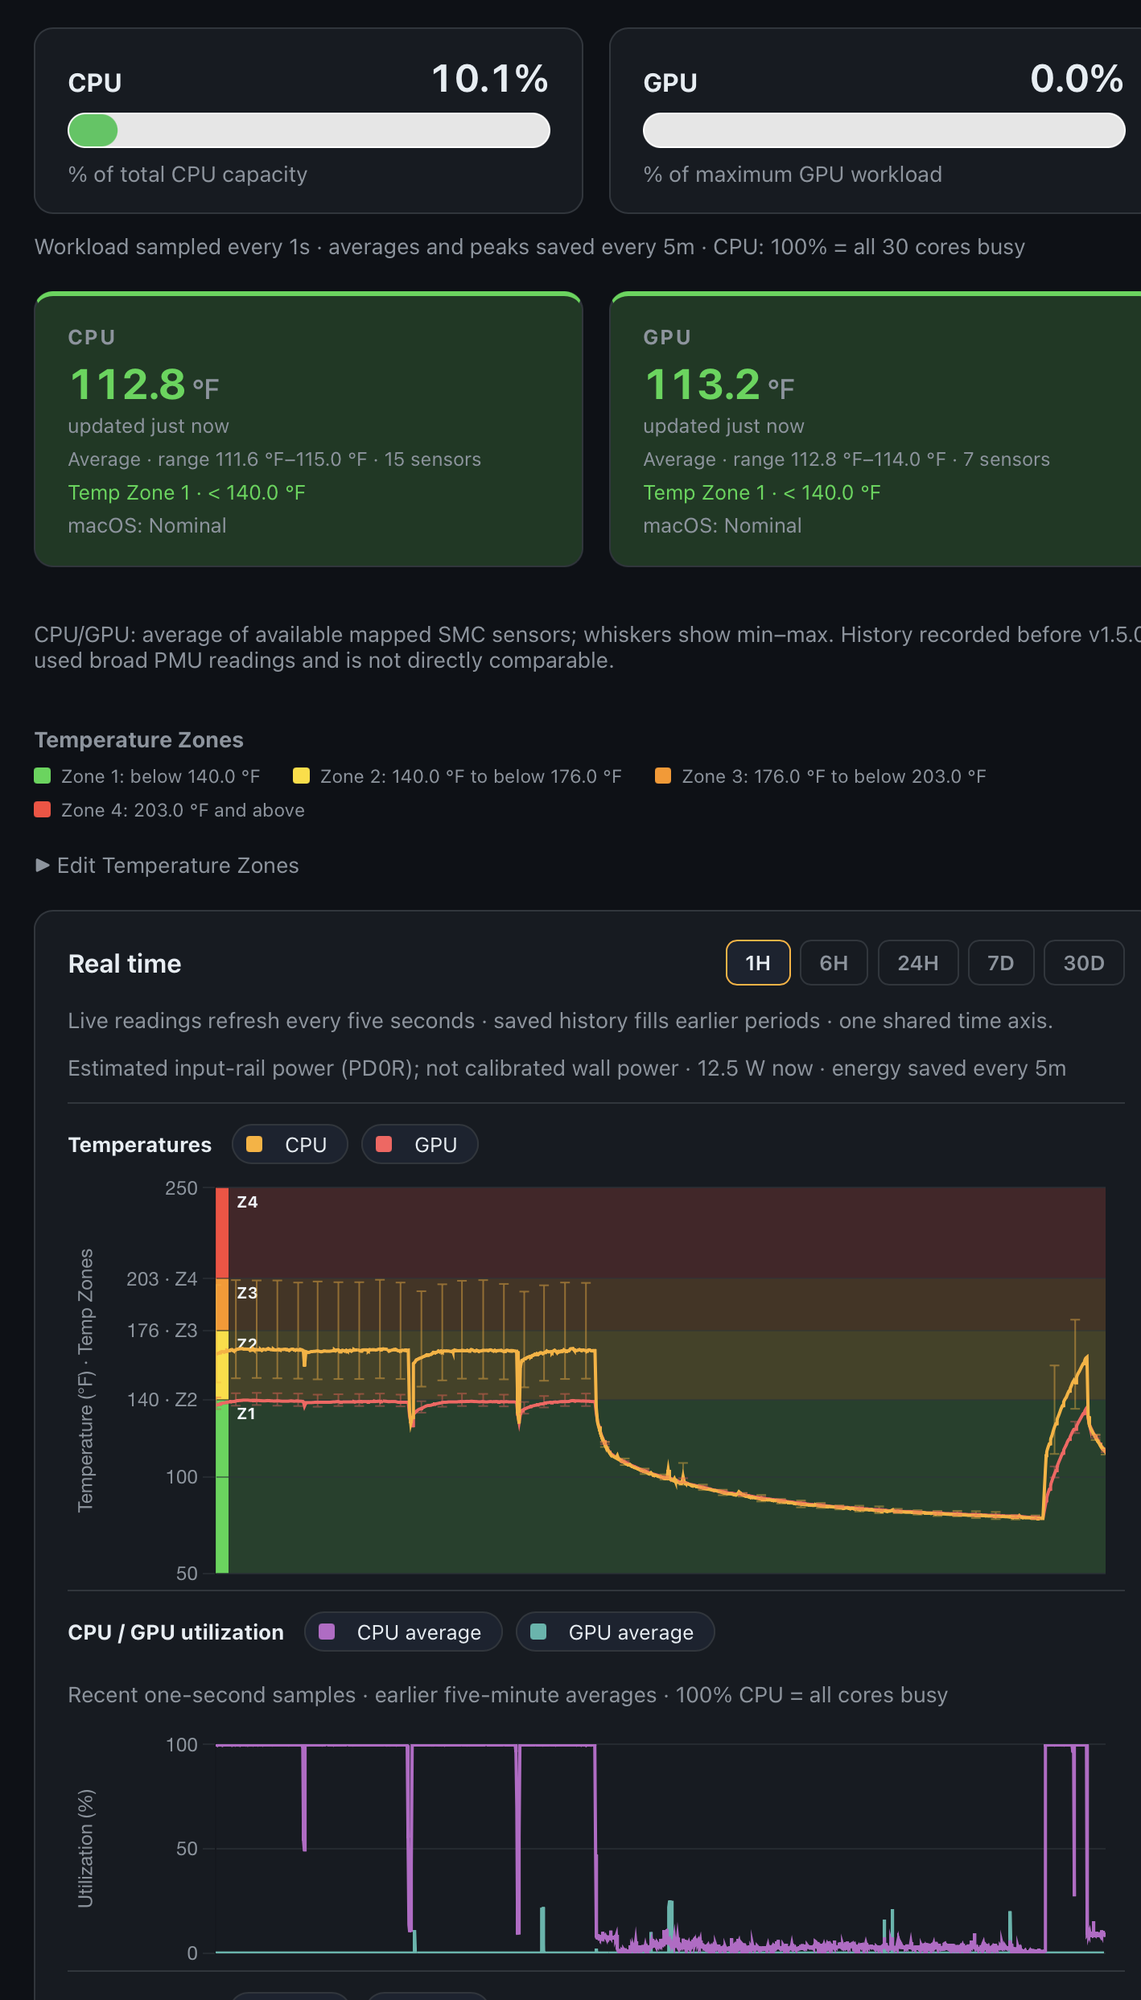
Temp Logger: CPU/GPU temperatures, utilization, and temperature zones over the last hour
It runs as a small local Node server that reads the Mac’s SMC sensors, saves readings to a SQLite database, and serves a dashboard in the browser. You get live CPU and GPU temperatures and utilization, fan speeds, estimated power draw, and history going back as far as 90 days.
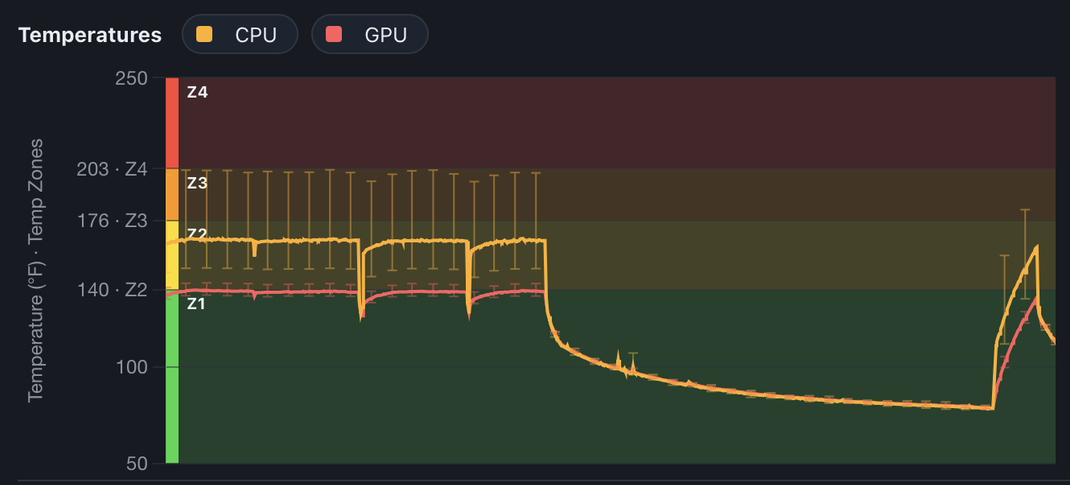
The chart above tells the story pretty well. With all 30 cores pinned at 100%, the CPU sits right around 160 °F while the GPU, doing nothing, still warms up to about 140 °F — they’re on the same chip. Once the load stops, both drop back toward 80 °F over the next half hour or so. I also added colored temperature zones so it’s easy to see at a glance when things move from “fine” into “warm.”
Vibe Coding It
The hard part turned out to be the sensors, not the dashboard. Each Apple Silicon chip has its own set of SMC sensor keys, and working out which ones are really the CPU and which are the GPU took some back-and-forth. I described what I wanted to see and let the AI do the digging and the plumbing; I mostly steered the dashboard until it answered my questions.
Try It on Your Mac
It should work on any Apple Silicon Mac, though I’ve only tested it on my Mac
Studio. The README has the
install steps — it’s basically npm ci, a build step for the sensor helper,
and npm start, then open the dashboard at http://127.0.0.1:49173.
If you run into problems, let me know by opening an issue.