A friend recently shared a graphic on Facebook with the comment “Telling!” It’s titled States Everyone Is Moving To — 2026 Edition, subtitled U.S. Net Domestic Migration by State. It comes from an Instagram post by The Shackelton Group, a real estate team at Real Broker in Scottsdale, Arizona. It ranks all 50 states from North Carolina (+84,064) down to California (−229,077), with Arizona highlighted at number five, and cites “U.S. Census Bureau Data.”
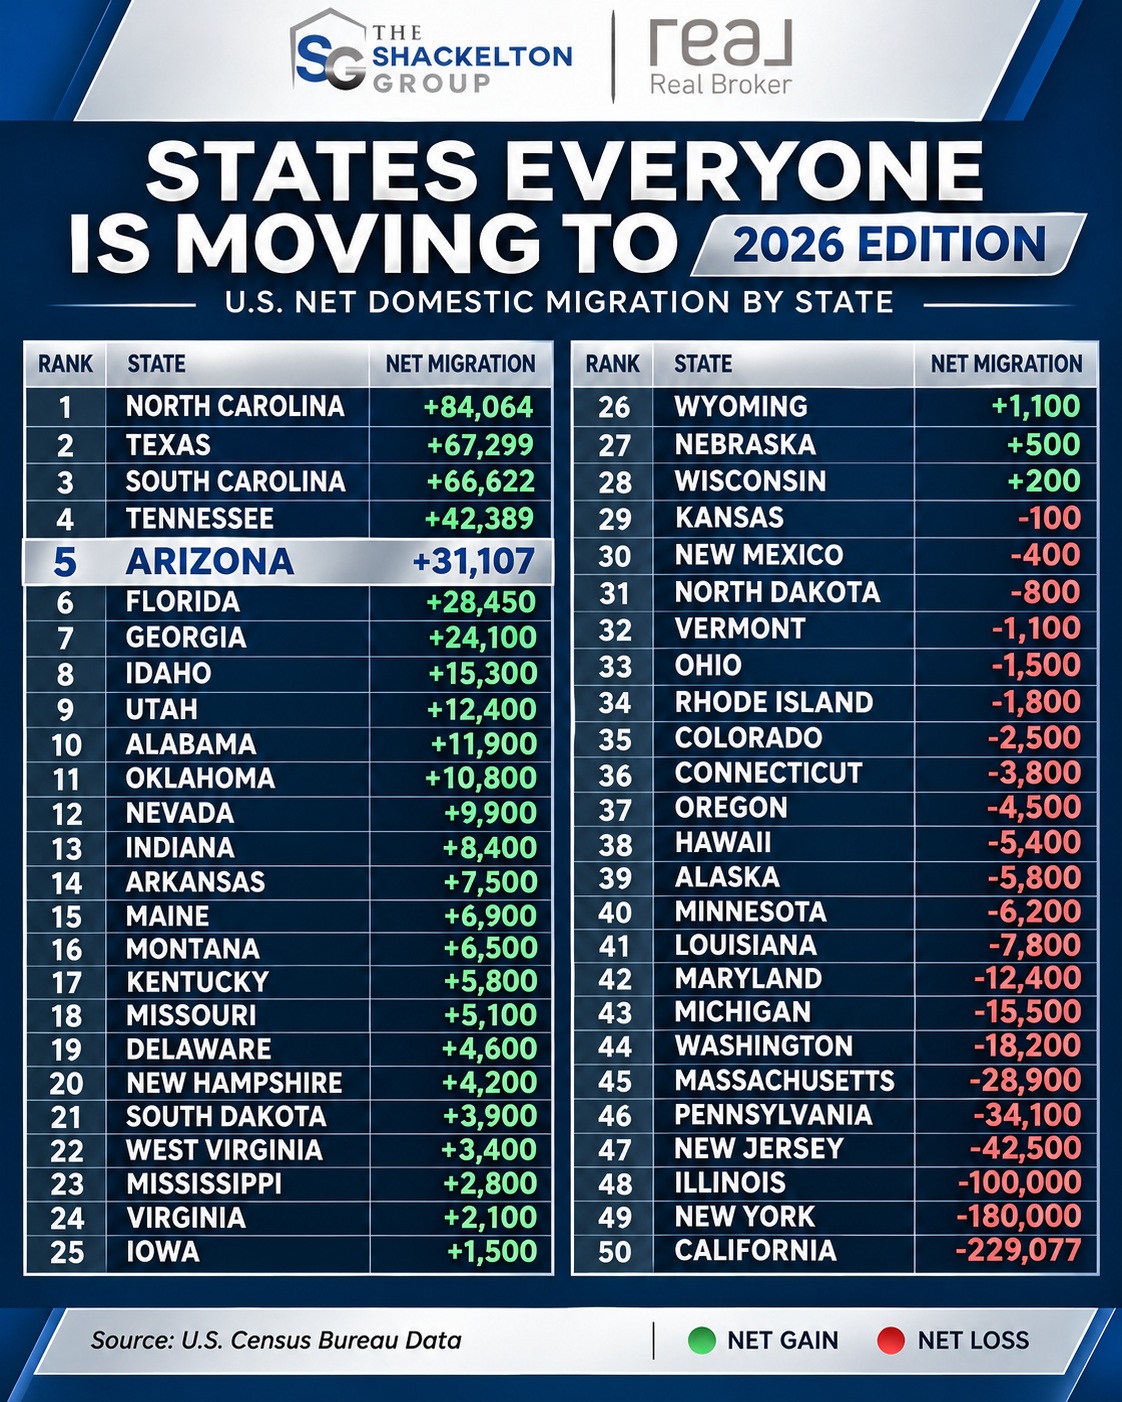
The graphic, from The Shackelton Group's Instagram post
It looks authoritative. I had just built a visualization of Census migration data, so I checked it.
The top five are right
Net domestic migration is the number of people who moved into a state from elsewhere in the U.S., minus the number who moved out to other states. It leaves out people moving to or from other countries. The Census Bureau estimates it every year as part of its population estimates.
The graphic’s top five match the Census Bureau’s latest estimates (Vintage 2025, covering July 1, 2024 to June 30, 2025) exactly, to the person:
| Rank | State | Graphic | Census |
|---|---|---|---|
| 1 | North Carolina | +84,064 | +84,064 |
| 2 | Texas | +67,299 | +67,299 |
| 3 | South Carolina | +66,622 | +66,622 |
| 4 | Tennessee | +42,389 | +42,389 |
| 5 | Arizona | +31,107 | +31,107 |
| 50 | California | −229,077 | −229,077 |
So does California at the bottom. Those are the six numbers most people will read.
The other 44 mostly aren’t
Every other number in the graphic is rounded to the hundred, and most of them don’t match the Census estimate for the same year. Only three (Maine, Montana and Maryland) come within 10% of it. This chart plots each state’s number in the graphic next to the Census figure:
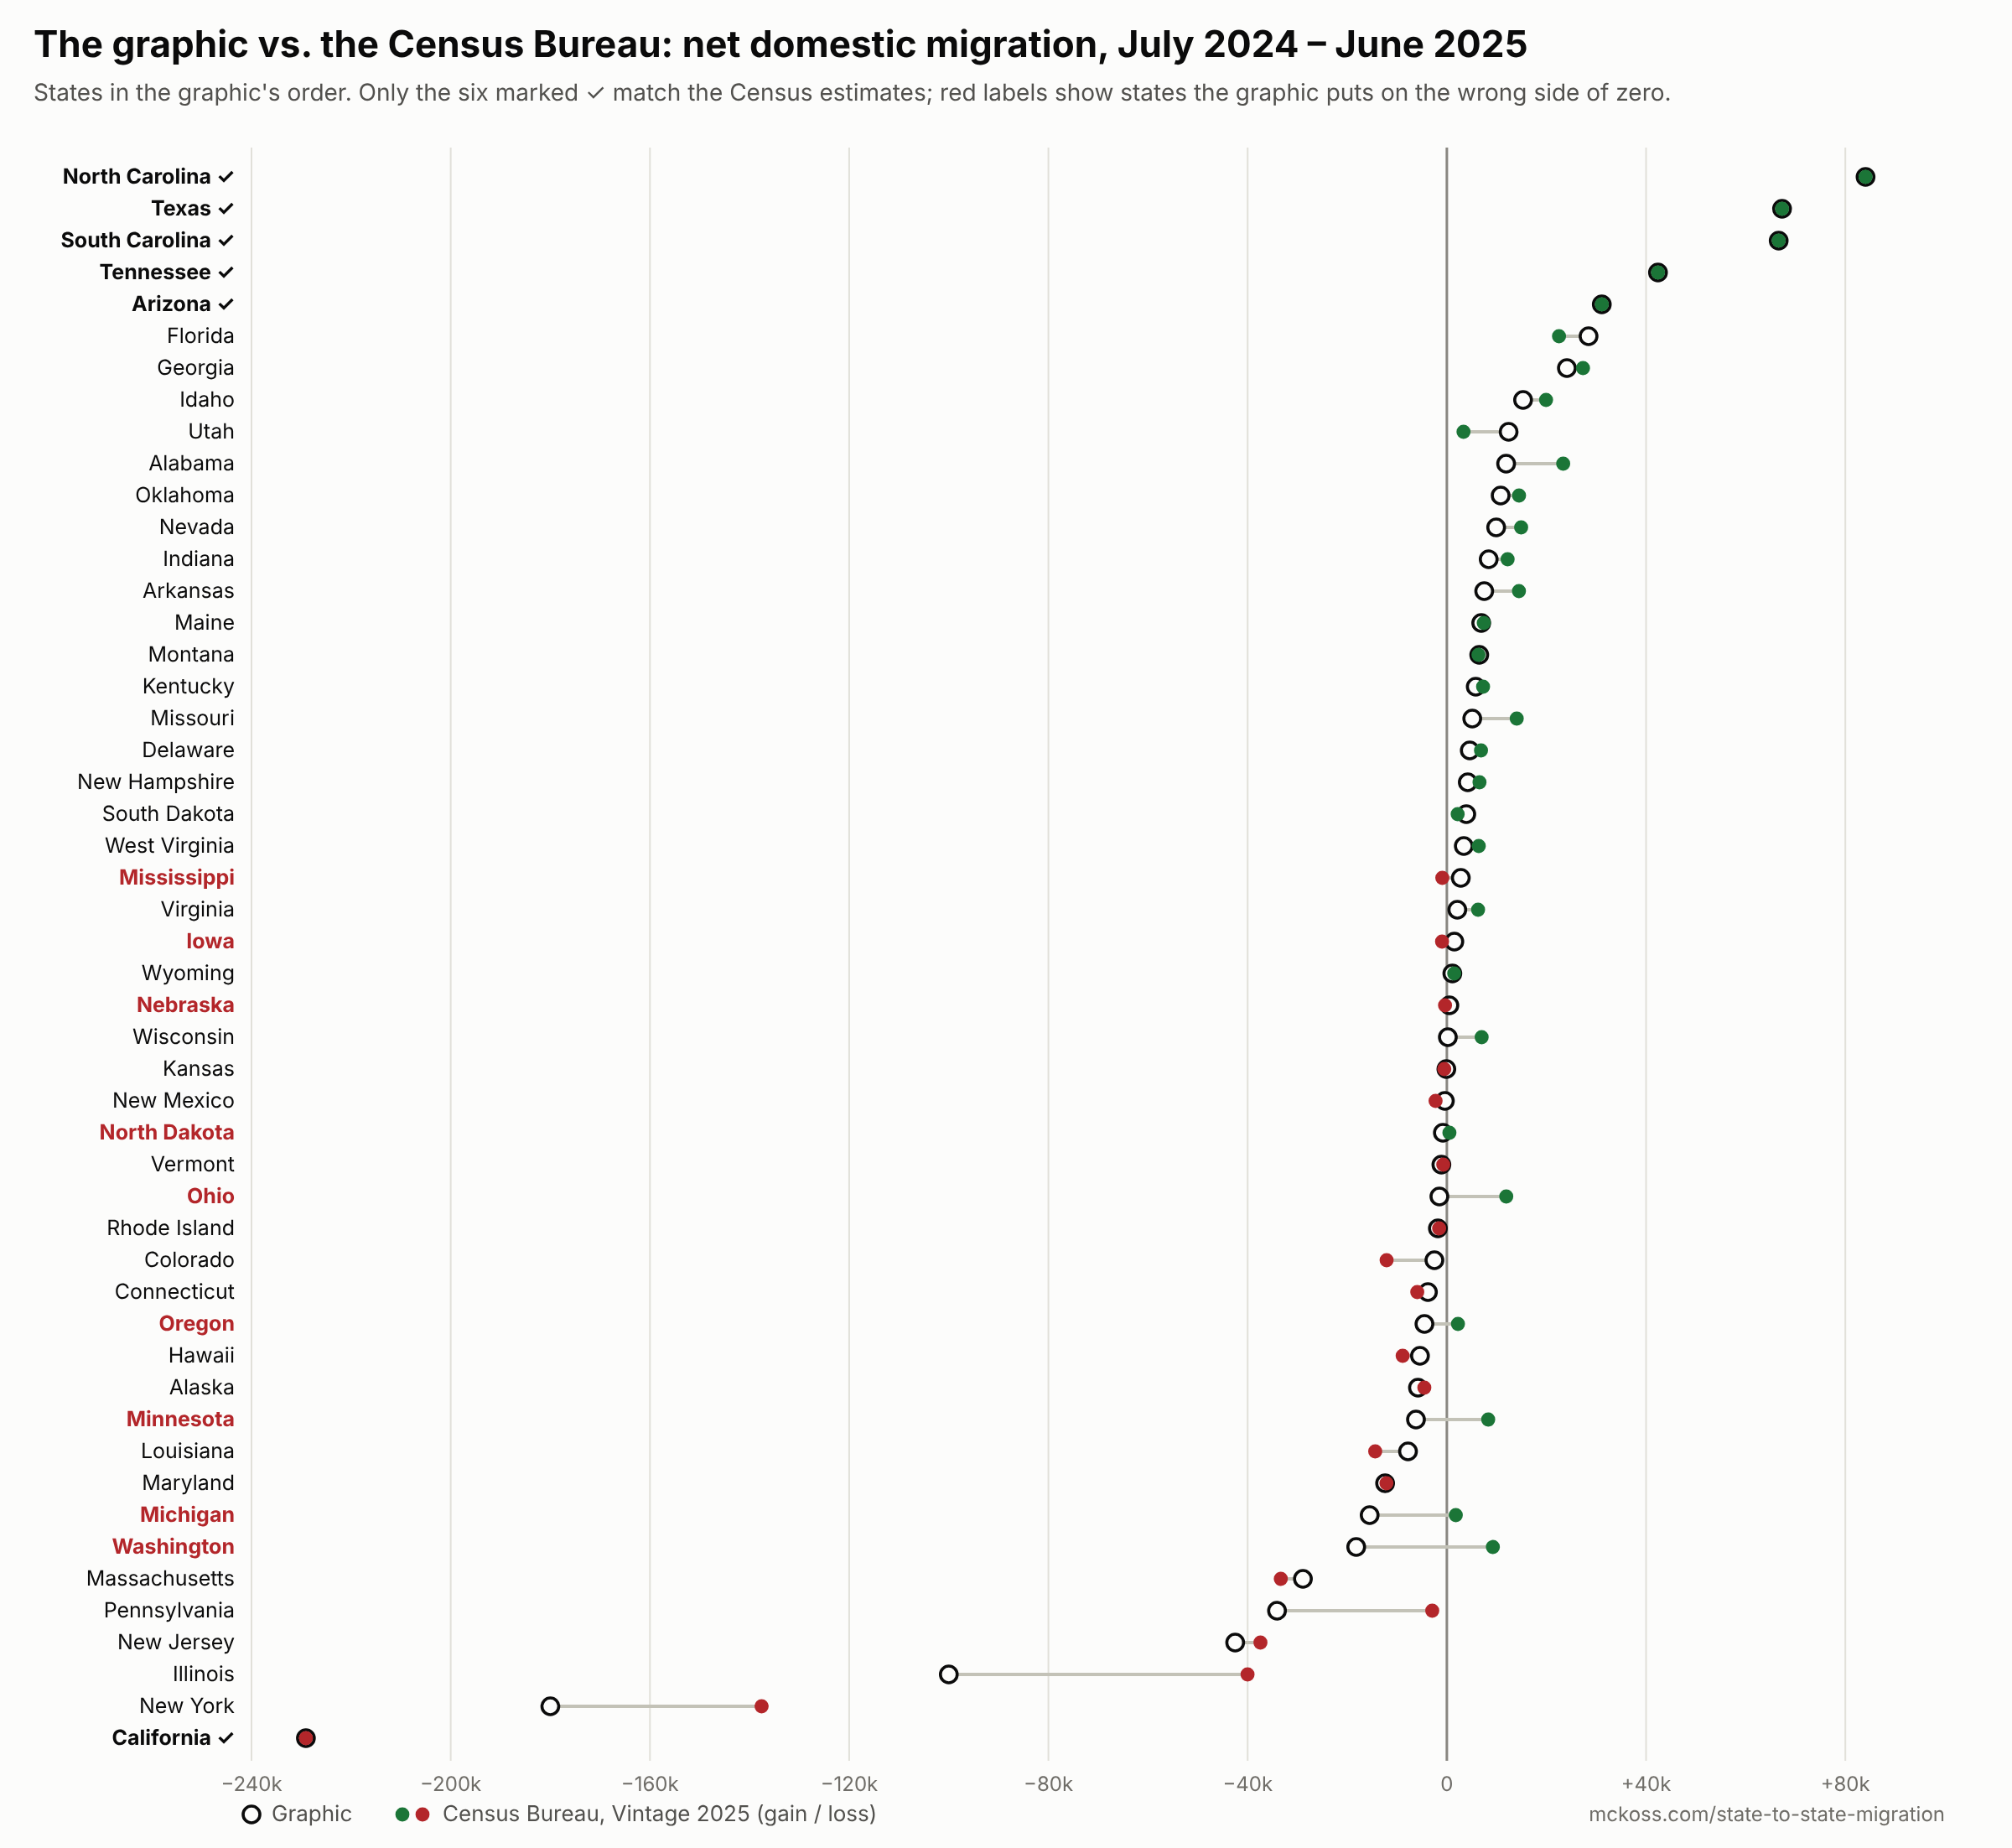
Each state's number in the graphic (open circle) next to the Census Bureau's estimate for the same year (filled dot)
Nine states are on the wrong side of zero. The graphic shows these states losing people when the Census Bureau estimates they gained, or the reverse:
| State | Graphic | Census |
|---|---|---|
| Washington | −18,200 | +9,238 |
| Michigan | −15,500 | +1,796 |
| Minnesota | −6,200 | +8,300 |
| Oregon | −4,500 | +2,228 |
| Ohio | −1,500 | +11,926 |
| North Dakota | −800 | +512 |
| Nebraska | +500 | −366 |
| Iowa | +1,500 | −970 |
| Mississippi | +2,800 | −917 |
Losses are inflated. Illinois appears at −100,000; the Census estimate is −40,017. New York appears at −180,000; the estimate is −137,586. Pennsylvania appears at −34,100; the estimate is −2,936.
The rankings are off. Ohio is the 15th-biggest gainer, not 33rd. Utah, shown in 9th place with +12,400, is 26th with +3,343. Alabama, shown 10th, is 7th.
Mixing years?
Some of the rounded numbers look like they came from earlier years. New York’s −180,000 is close to the Census estimate for 2023 (−177,852). Washington’s −18,200 is close to its 2023 estimate (−17,511). Pennsylvania’s −34,100 is close to the 2023 figure from a different Census survey, the American Community Survey (−34,884).
But no single year, from either the population estimates (2021–2025) or the American Community Survey (2005–2024), matches the rest. The closest year jumps around from state to state, and some numbers don’t match anything. I can’t tell where they came from. What I can say is that only six numbers in the graphic are Census figures for the year it implies.
It doesn’t add up
Net domestic migration is a zero-sum count. Every person who leaves one state for another is a gain somewhere else, so the 50 states and D.C. always add up to zero. In the Census estimates, the gainers added 549,788 people and the losers lost exactly 549,788.
The graphic’s gains add up to 468,831 and its losses to 702,377. That’s 233,546 people who leave their states and never arrive anywhere.
What “everyone” means
Even the correct numbers are smaller than the headline suggests. North Carolina’s +84,064 is 0.75% of its population. It’s also the small difference between two big flows: the American Community Survey counts about 300,000 people moving to North Carolina from other states in 2024, and about 241,000 leaving for other states.
The graphic counts only domestic moves. Add people arriving from other countries, and 45 of the 50 states plus D.C. gained people through migration in 2024–25. And despite the “2026 Edition” label, the data covers mid-2024 to mid-2025.
Check it yourself
The State-to-State Migration visualization maps the Census data behind all of this. One map shows the Census Bureau’s latest estimates of net migration for every state: total, domestic or international, in people or per 1,000 residents.
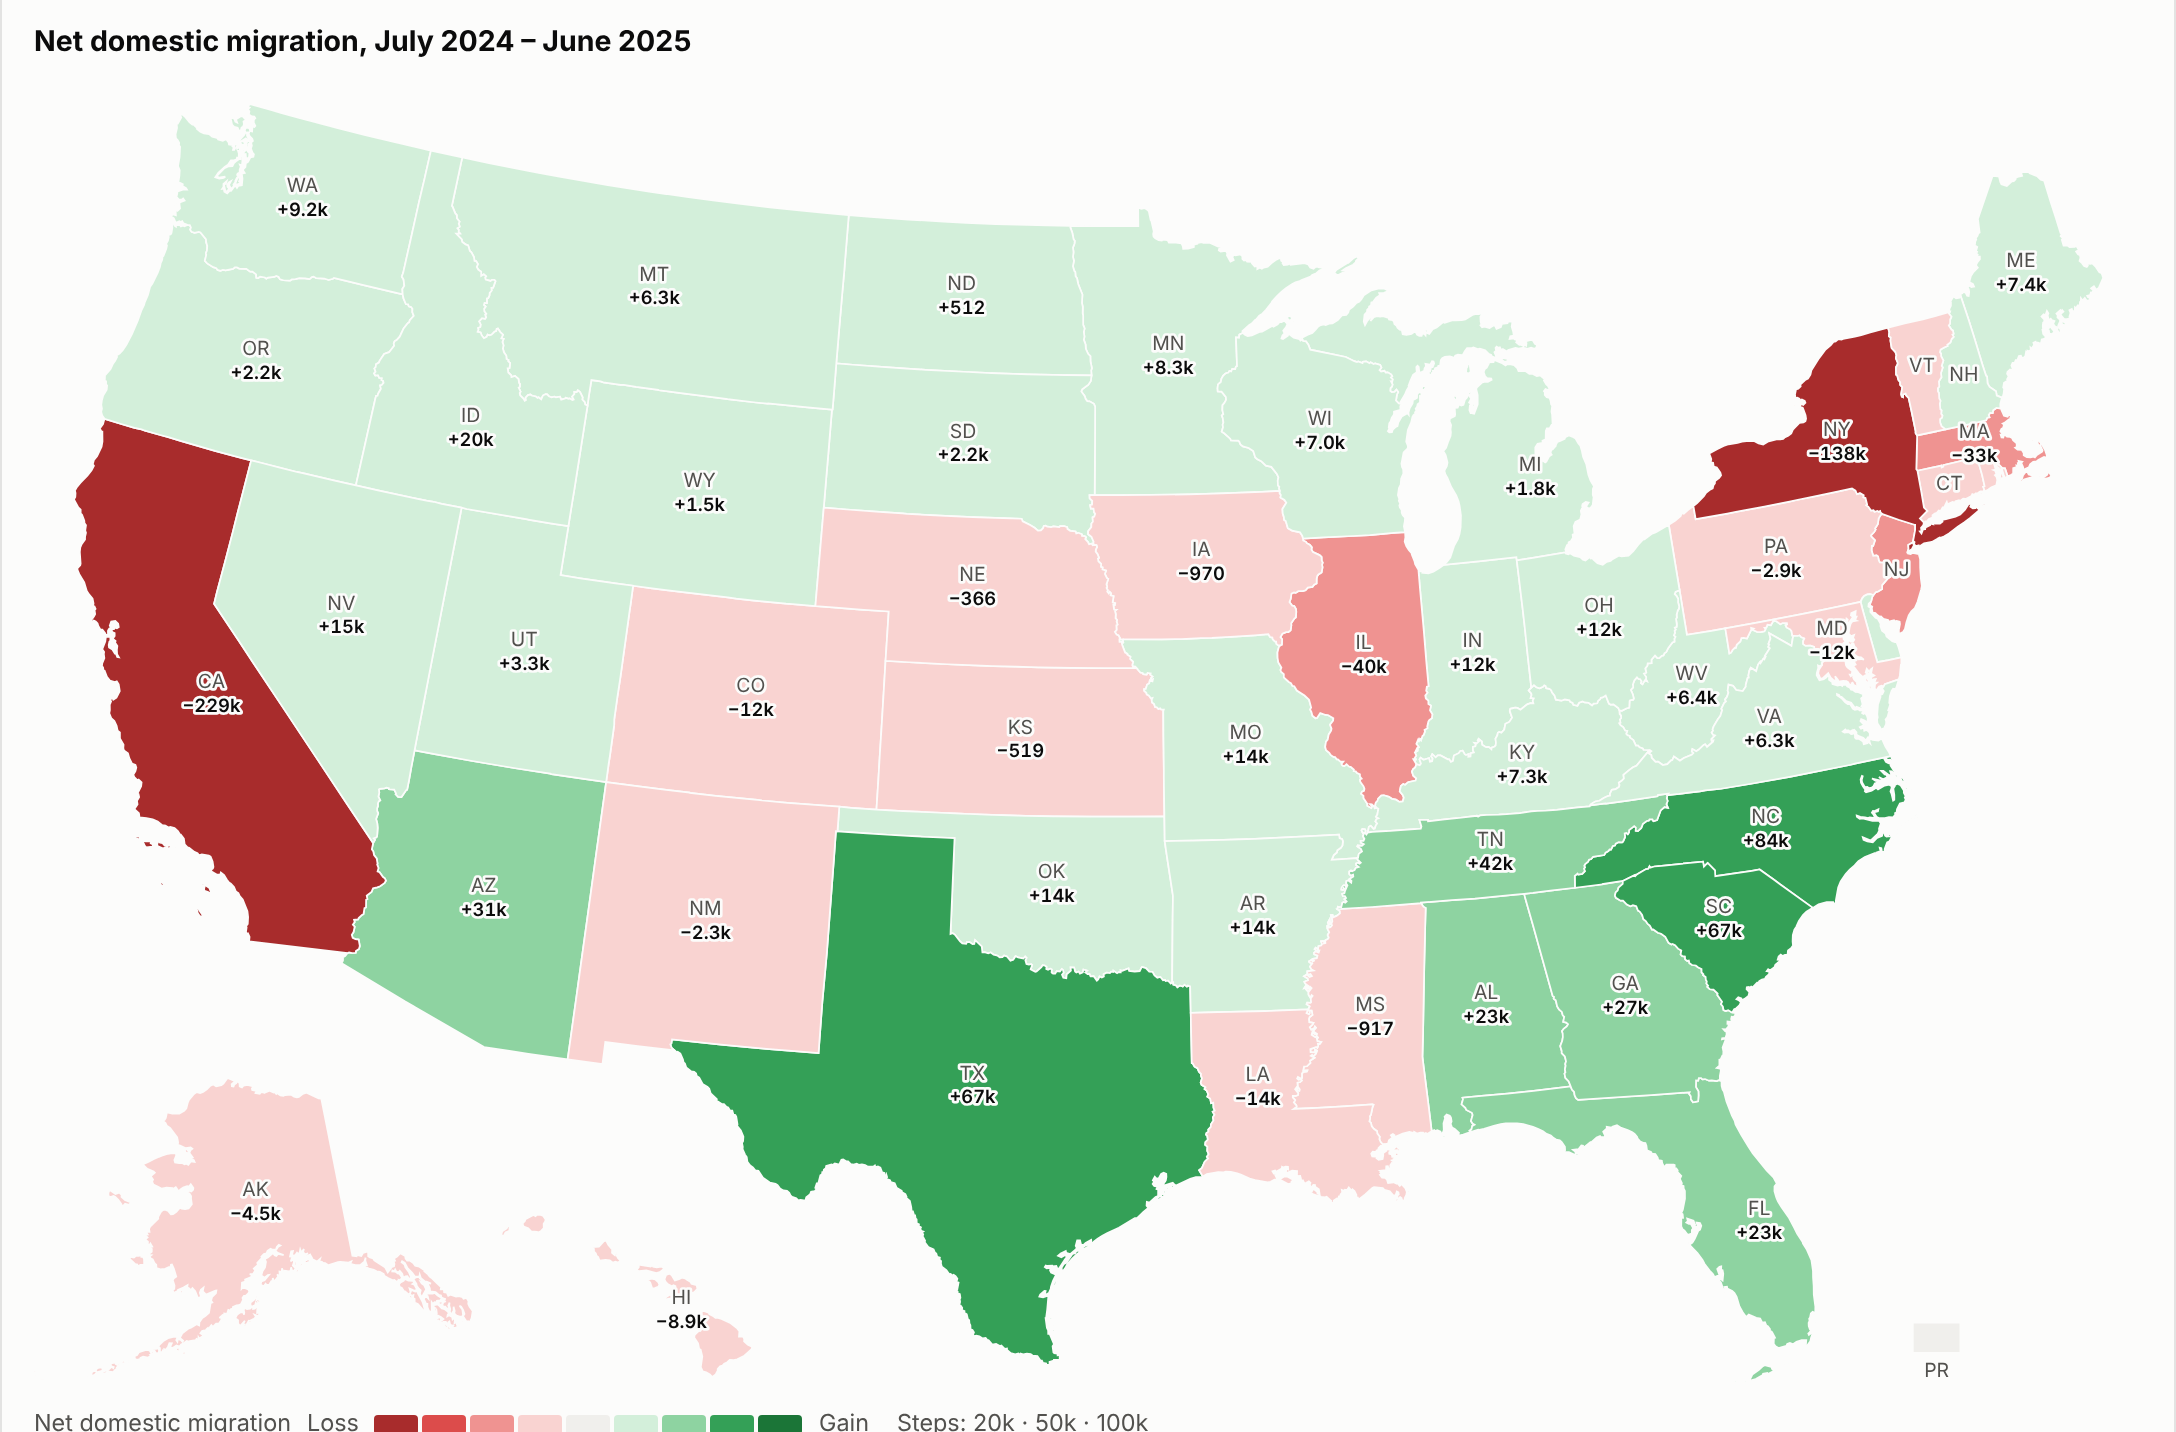
Net domestic migration, July 2024 – June 2025, from the Census Bureau's Vintage 2025 population estimates
The main map goes deeper. It uses the American Community Survey’s state-to-state tables, which count how many people moved between each pair of states every year since 2005. Pick a state to see where its newcomers came from and where its leavers went, with arrows sized by the number of people. Hovering shows each estimate’s margin of error. Many of the smaller flows aren’t statistically different from zero, and the map draws those dashed.
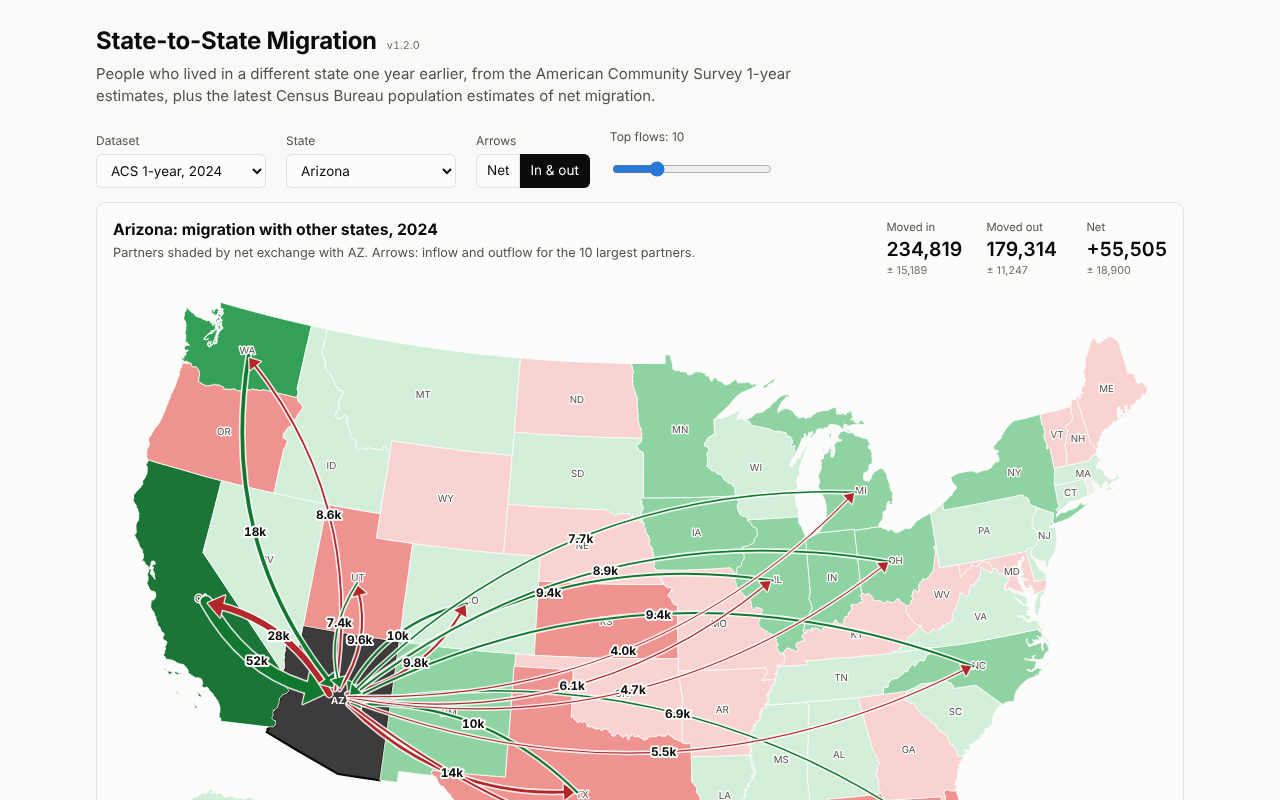
Arizona's biggest exchanges with other states in 2024: green arrows bring people in, red arrows take them out
The data is stored with the site and checked against the Census Bureau every month, so it updates itself when new estimates come out. The code is on GitHub.
The visualization and this post were made with the help of Claude Code.